
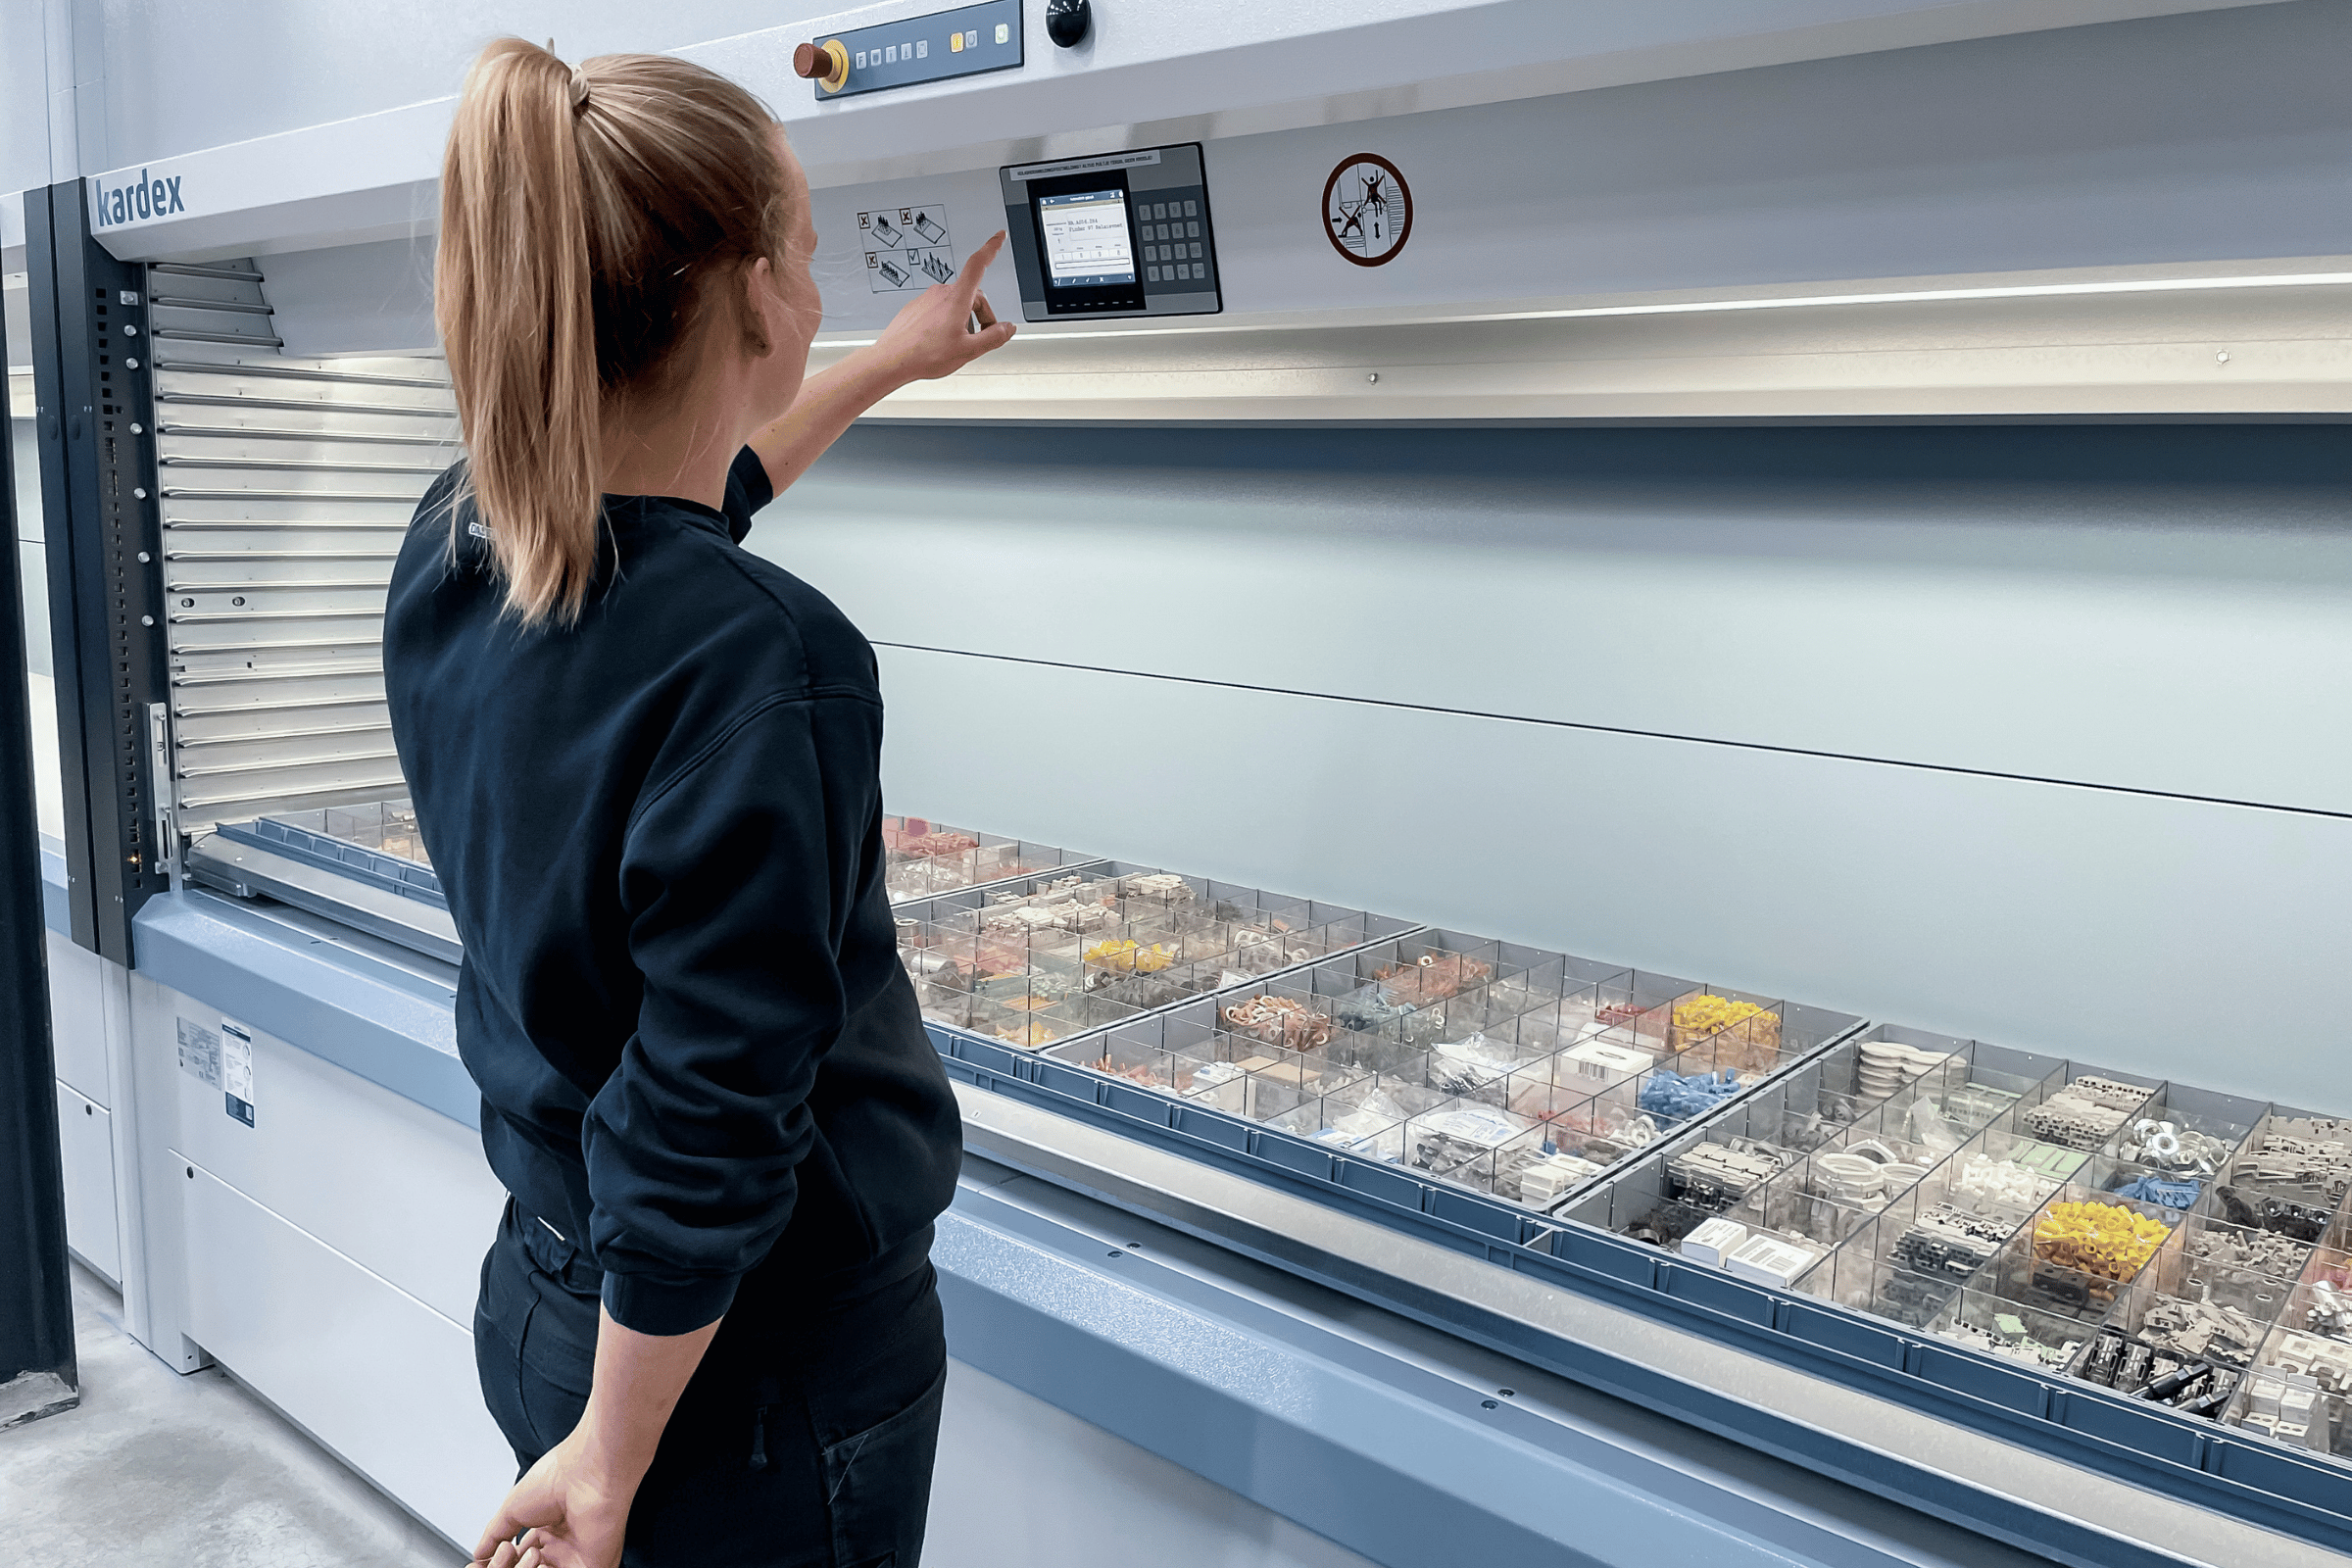
Inventory represents a major commitment of working capital, warehouse space, and operational effort. The amount of stock on hand matters, but so does how efficiently that inventory moves through the operation and converts back into sales.
According to a Kardex survey of warehouse professionals, 62.3% cite inventory control as a top challenge, and inventory turnover ratio provides one of the clearest measures of whether control practices are translating into efficient inventory flow or leaving too much capital tied up in stock.
In this guide, we’ll explain what inventory turnover means, how to calculate it, and how to interpret the result. From there, we examine the operational levers that can improve turnover without creating unnecessary risk to the timely fulfillment of orders.
What Is Inventory Turnover?
Inventory turnover describes how much product a company sells and replaces in a given period. An inventory turnover ratio expresses that activity as an efficiency metric by comparing the cost of goods sold with the average value of inventory held over the same period, typically one year.
An inventory turnover ratio is represented by a number. For instance, if a given company’s annual inventory turnover ratio is 7.6, it means that they turned over their inventory approximately 7.6 times that year.
The ratio can be calculated across an entire enterprise, for a particular warehouse, or for a specific retail location. It provides a quick view of how efficiently stock is moving through the business.
- Higher turnover: Inventory sells and is replenished more frequently, generally indicating strong movement and less capital tied up in stock.
- Lower turnover: Inventory remains on hand longer, potentially signaling overstock, slowing demand, or deadstock.
How to Calculate Inventory Turnover
The formulas below illustrate how to calculate inventory turnover. The term merchandise turnover ratio generally refers to the same approach to calculating inventory turns in a more retail-focused environment.
The standard inventory turnover formula divides cost of goods sold (COGS) by average inventory for the same period:
Inventory Turnover Ratio = COGS ÷ Average Inventory
COGS is the preferred numerator because both COGS and inventory are measured at cost.
Average inventory is typically calculated using beginning and ending inventory:
Average Inventory = (Beginning Inventory + Ending Inventory) ÷ 2
Some companies use sales revenue divided by average inventory when COGS is unavailable. This variation can produce a higher ratio because sales revenue includes markup. At the SKU or product level, businesses may instead divide units sold by average units on hand.
For seasonal or rapidly changing inventories, averaging monthly or quarterly inventory balances can provide a more representative result than relying only on beginning and ending values.
Inventory Turnover Calculation Example
Assume a company reports:
- Annual COGS: $2,400,000
- Beginning inventory: $400,000
- Ending inventory: $500,000
First, calculate average inventory:
($400,000 + $500,000) ÷ 2 = $450,000
Then calculate inventory turnover:
$2,400,000 ÷ $450,000 = 5.33
The company turned over its average inventory approximately 5.3 times during the year.
How to Calculate Days Inventory Outstanding
Days inventory outstanding (DIO) is a closely related metric which expresses inventory turnover as the average number of days inventory remains on hand.
DIO can be calculated using the formula:
DIO = 365 ÷ Inventory Turnover Ratio
Using the example above:
365 ÷ 5.33 = 68.5 days
The company therefore holds inventory for approximately 69 days before it is sold or otherwise moved out of stock. That figure can be compared with supplier lead times, replenishment schedules, product shelf life, and working-capital targets. DIO is particularly useful for operations managing seasonal, perishable, or rapidly obsolete inventory, where each additional day in storage carries a more immediate cost or risk.
While turnover ratio provides a useful high-level efficiency benchmark, DIO can feel more actionable for warehouse, purchasing, and finance teams because it converts that performance into a practical holding period.
What Is a Good Inventory Turnover Ratio?
A “good” inventory turnover ratio depends heavily on industry context. Product shelf life, demand patterns, lead times, assortment complexity, and standard inventory practices all influence how quickly stock can reasonably move. As a result, comparing turnover across fundamentally different industries can be misleading. The most useful benchmarks come from similar businesses, operations, and product categories.

Why Low (or Too-High) Turnover Is a Problem
Inventory turnover is not a metric to maximize without limit. Low turnover leaves more capital tied up in stock while consuming warehouse space and adding storage, handling, and insurance costs. As unsold inventory ages, it is more likely to become obsolete or turn into deadstock. Longer storage periods can also increase exposure to damage, misplacement, and inventory shrinkage.
Low turnover also increases the risk of stock obsolescence. Costs can escalate when obsolete inventory remains recorded as available stock. The operation may appear to have sufficient inventory until an item is needed, forcing urgent purchases and expedited delivery when the existing stock cannot fulfill the requirement. As Jeff Peters, Regional Business Director at Kardex Remstar, explains:
“We visited a customer recently whose inventory costs had skyrocketed. They were making urgent spot purchases for items they thought were in stock but were actually obsolete. Between the rush buys and the expedited freight, their handling costs had gone up fivefold.”
Jeffrey Peters
Regional Business Director with Kardex
Excessively high turnover creates a different set of risks. Inventory levels may be too lean to absorb demand changes, supplier delays, or other supply chain disruptions, resulting in stockouts, missed sales, production delays, and costly expedited orders. An appropriate safety stock strategy helps maintain turnover without leaving the operation exposed.
Inventory Carrying Cost and Its Link to Turnover
Inventory carrying cost is the total expense associated with holding unsold stock over time. The purchase price of inventory is only one part of that commitment. Carrying cost typically includes:
- Capital costs: The financing expense or opportunity cost of cash tied up in inventory.
- Storage and handling costs: Warehouse space, utilities, equipment, and labor required to store and move stock.
- Service costs: Insurance, taxes, inventory systems, and other administrative expenses.
- Inventory risk: Losses associated with damage, shrinkage, depreciation, expiration, and obsolescence.
Turnover and carrying cost are closely connected aspects of warehouse inventory management. When inventory turns slowly, products remain in storage longer and continue accumulating costs without generating revenue. Slow-moving inventory also occupies capacity that could be used for more productive stock. Improving turnover reduces the average time inventory is held and can lower the capital, space, and risk costs associated with each unit.
The ultimate goal is not simply to minimize carrying cost by holding as little inventory as possible. Businesses need to balance these expenses against service levels, supplier lead times, demand variability, and the cost of potential stockouts.
How to Improve Inventory Turnover
Improving turnover requires aligning inventory levels more closely with actual demand and ground-level inventory management operations. The following practices help reduce excess stock while preserving the availability needed to maintain service levels and adaptability.
1. Sharpen demand forecasting
Use historical sales, seasonality, promotions, and recent demand patterns to improve purchasing and production forecasts. A demand-driven inventory strategy helps prevent stock from accumulating after customer needs have shifted. Measure forecast accuracy at the SKU or inventory-class level so broad averages do not conceal individual items that are consistently over-forecast. Update forecasts on a rolling basis as new demand signals emerge.
2. Right-size safety stock
Safety stock protects against demand variability and supplier delays, but carrying more than the operation needs slows turnover and increases holding costs. Review safety stock levels using current demand, lead times, and service targets rather than leaving buffers unchanged. Apply higher protection to critical or difficult-to-replace items and leaner buffers where demand and supply are more predictable. Recalculate levels when supplier performance, order patterns, or service requirements change to maintain a rationalized balance between just-in-time and just-in-case inventory.
3. Identify and clear deadstock
Regularly flag SKUs with little or no movement so they do not remain hidden within total inventory. Depending on the product and business model, deadstock may be promoted, returned to a supplier, transferred to another location, recycled, or written off. Establish a clear inactivity threshold and assign responsibility for reviewing affected inventory. The review should also identify why the stock stopped moving so the same purchasing or forecasting decision is not repeated.
4. Improve real-time visibility
Accurate movement data from robust inventory tracking systems should show which items are selling, slowing down, or sitting idle. SKU- and location-level visibility helps teams identify changing demand earlier and make better decisions about purchasing, transfers, and inventory disposition. Focus reporting on exceptions that require action, such as declining velocity, growing days on hand, or replenishment that exceeds consumption.
5. Tighten replenishment
Translate demand data into reorder points, order quantities, and purchasing schedules that reflect current conditions. More responsive inventory replenishment can reduce excess stock while maintaining enough availability to avoid costly stockouts. Replenishment parameters should account for supplier lead times, minimum order quantities, variability, and ordering costs rather than arbitrarily favoring smaller purchases.

How Vertical Storage Automation and Software Improve Turnover
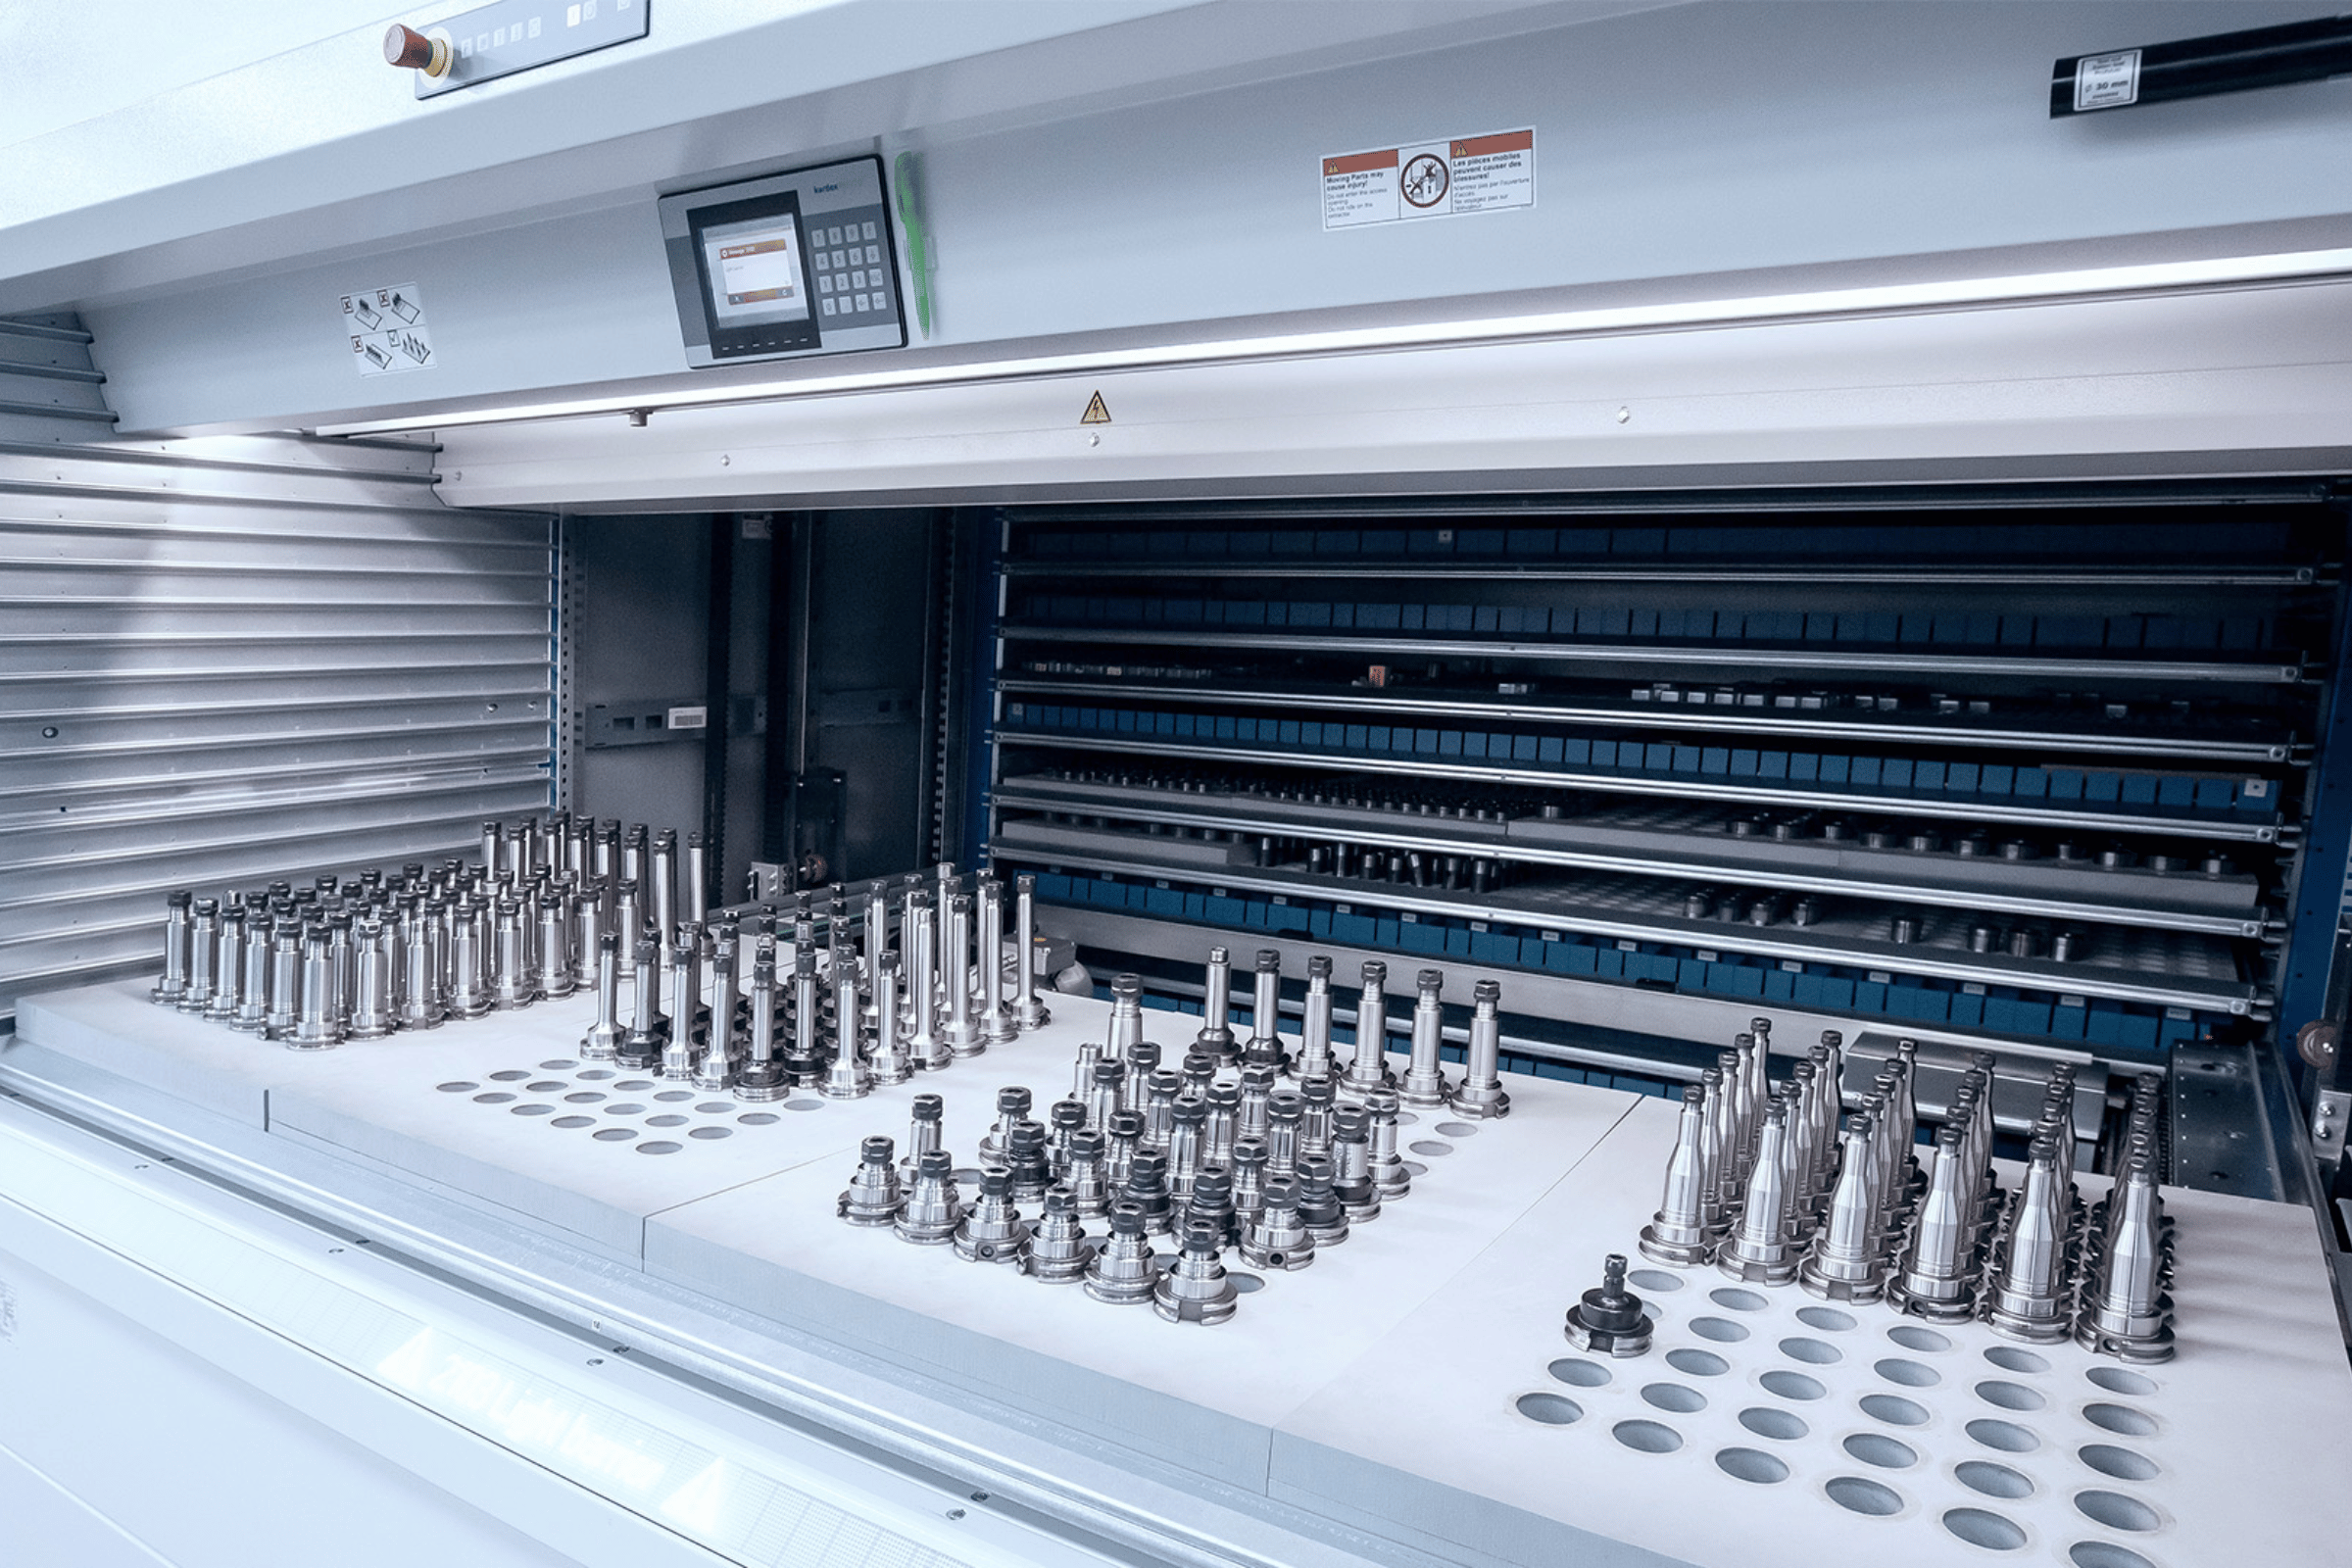
An automated storage and retrieval system (ASRS) combines automated equipment and software to place inventory in assigned locations and retrieve it when needed. Vertical ASRS systems use available building height and deliver inventory to a controlled access point, reducing the travel and manual handling required to store, pick, count, and return items.
When an ASRS is integrated with inventory management software, each receipt, storage transaction, pick, and return contributes to a current record of inventory activity. Reporting tools can then show which SKUs move frequently, which are slowing down, and which have remained idle for extended periods.
This visibility helps teams address the operational causes of low turnover. Slow-moving and non-moving inventory can be identified earlier, replenishment can be adjusted to reflect actual usage, and stock can be transferred, returned, or cleared before it consumes more capital and storage capacity. Different ASRS configurations apply these capabilities at different scales and levels of throughput.
The appropriate combination of automated storage and software depends on the inventory profile, throughput requirements, and complexity of the broader warehouse operation.
Find the Right Inventory Strategy for Your Operation
Inventory turnover ratio provides a clear measure of how efficiently stock moves through the business. Improving it requires stronger forecasting, appropriately sized inventory levels, timely action on deadstock, and reliable visibility into movement and demand. These practices should work together within a broader warehouse inventory management strategy, supported by a responsive replenishment process.
For operations considering automated storage, the next step is determining how a system would fit the warehouse’s actual inventory profile and workflows. Seeing a comparable installation in operation can make that evaluation more concrete and help employees understand how their day-to-day work would change.
“The biggest worry is the same one everybody has: change. How will employees react? Will they miss the old way? That’s exactly why we bring prospects to see a system running at an existing customer’s site.”
“The biggest worry is the same one everybody has: change. How will employees react? Will they miss the old way? That’s exactly why we bring prospects to see a system running at an existing customer’s site.”
Jeffrey Peters
Regional Business Director with Kardex
Kardex can assess your inventory, turnover patterns, and operational requirements, then help you explore an appropriate automated storage configuration or arrange a visit to an existing customer site.
